

Over the last twenty years, Japanese real residential property prices have declined by roughly 1.40 percent per quarter. Over the same period UK and US real residential property prices have increased by 3.73 and 2.03 percent, respectively (see here). This incredible outcome is a consequence of Japan’s dynamic and deregulated housing market.
In Economic Facts and Fallacies (2011), Thomas Sowell argues that housing regulation and zoning laws, not markets, are to blame for the modern scourge of unaffordable housing. Sowell is still right. Government housing regulations have exacerbated construction costs, reduced the elasticity of the housing supply, and worsened the vicious problem of homelessness.
A 2014 NBER (National Bureau of Economi Research) review of the current housing regulation literature confirmed what economists already knew: “regulation appears to raise house prices, reduce construction, reduce the elasticity of the housing supply, and alter urban form.” Complying with regulation is not only time consuming, but often requires detailed knowledge of local bylaws and the purchase of expensive permits. Restrictive zoning laws are particularly egregious, frequently and unnecessarily rendering certain areas unusable for housing. However, many seem to be unconvinced of the significance of this problem, preferring to blame rich investors, unsustainable population growth or growing incomes. Wouldn’t local regulations be unimportant compared with macroeconomic trends? Such claims are inconsistent with the evidence. A Reserve Bank of Australia working paper found that, “as of 2016, zoning raised detached house prices 73% above marginal costs in Sydney, 69% in Melbourne, 42% in Brisbane and 54% in Perth.” We know that regulations push up prices. Furthermore, they are frequently more influential than any demand side factor commonly blamed in the media.
In the 1970s, Californian governments regulated housing markets on a level not previously seen. Unsurprisingly, house prices exploded. This explosion cannot be blamed on population growth: over a ten year period starting in the 1970s, the average Palo Alto house price nearly quadrupled while population growth in that region was close to zero (Sowell 2011). The Las Vegas population almost tripled between 1980 and 2000, yet “real median house prices did not change” (Glaeser, Gyourko, and Saks 2005).
This takeoff cannot be blamed on incomes, either. Dallas has consistently achieved a growth of household incomes roughly 10 percent higher than the US average, while its house prices are generally lower than the US average (O’Toole 2006); the same is true of Houston. In the 1970s, real income in California grew more slowly than the national average, yet the takeoff took place (Sowell 2011).
Nor can this takeoff be blamed on inflation. The Foster City housing project of the 1960s (San Mateo, California), sold houses at prices between $22,000 and $50,000. In 2005, the average Foster City home price exceeded $1 million (Sowell 2011). These price increases dwarf the effects of inflation. In a ranking of America’s least affordable housing markets, seventeen were located in California. In a 2018 ranking, California was the third least affordable state in the US. Texas, the second largest economy behind California, was ranked twenty-third.
One need only compare house prices in California with those of Texas to see the lasting scars of so-called smart planning. Over the last twenty years, the Texas population has increased faster than that of California, and real GDP growth has been roughly the same in both states. Yet Californian house prices have grown faster ever year (see figure 2). The story becomes even clearer when we focus on individual cities. Despite being the fourth largest city (by population) in the US, the Houston market is ranked twenty-fourth in the world for affordability among major cities (those with populations greater than 1 million). This remarkable achievement can be largely attributed to the fact that Houston has no zoning laws.
Figure 1

Source: FRED (see here and here).
Figure 2
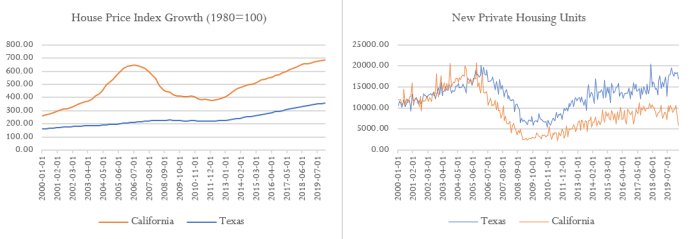
Source: FRED (see here and here).
Texas is not alone. Japan teaches us that population size does not dictate affordability. In the below table, we compare Tokyo with London.
| Urban Area | Tokyo | London |
|---|---|---|
| Population Density | 6,158 per square kilometer (source) | 5,701 per square kilometer (source) |
| Average Annual Salary (USD) | $50,655 (source) | $52,000 (source) |
| Monthly Housing Costs (USD) | $1,951.5 | $2,547.8 |
| Housing Price World Ranking | 16th | 5th |
Note: data on housing costs and price level rankings comes from UBS, Prices and Earnings 2018.
Tokyo is the largest city by population in the world, with 37,435,191 people. But when world cities are ranked from highest house prices to lowest, Tokyo is sixteenth. Tokyo housing is more affordable than in Hong Kong, Paris, New York, Los Angeles, Chicago, Sydney, and Zurich. Over the last twenty years, Japanese real residential property prices have declined by roughly 1.40 percent per quarter. Over the same period UK and US real residential property prices have increased by 3.73 and 2.03 percent, respectively (see here). This incredible outcome is a consequence of Japan’s dynamic and deregulated housing market.
