MCViewPoint

Opinion from a Libertarian ViewPoint

Posts Tagged ‘Bureau of Labor Statistics’

Shrinkflation and Skimpflation Are Eating Our Lunch | Mises Wire

Posted by M. C. on July 20, 2023

And while firms are reducing the quantity and quality of the food they sell, consumers are also choosing to purchase less food and even lower-quality food. The January 2023 report on consumer inflation sentiment shows that 69.4 percent of respondents “reduced quantity, quality or both in their grocery purchases due to price increases over the last 12 months.”

https://mises.org/wire/shrinkflation-and-skimpflation-are-eating-our-lunch

Jonathan Newman

Economist Jeremy Horpedahl dismissed the silly claim by anticapitalists that capitalism must engineer food scarcity for the sake of profits. He presented a graph of Bureau of Labor Statistics (BLS) data demonstrating a substantial decrease in household food expenditure as a percentage of income—from 44 percent in 1901 to a mere 9 percent in 2021. This is something to celebrate and certainly can be attributed to the abundance of market economies.

But when Jordan Peterson asked, “And what’s happened the last two years?” I went digging. First, I confirmed Horpedahl’s observation: the amount we spend on food as a proportion of our budget has fallen dramatically. Second, I saw what Peterson hinted at: a significant spike in food spending when covid and the associated mess of government interventions hit (figure 1).

Figure 1: Food and personal consumption expenditures, 1959–2023

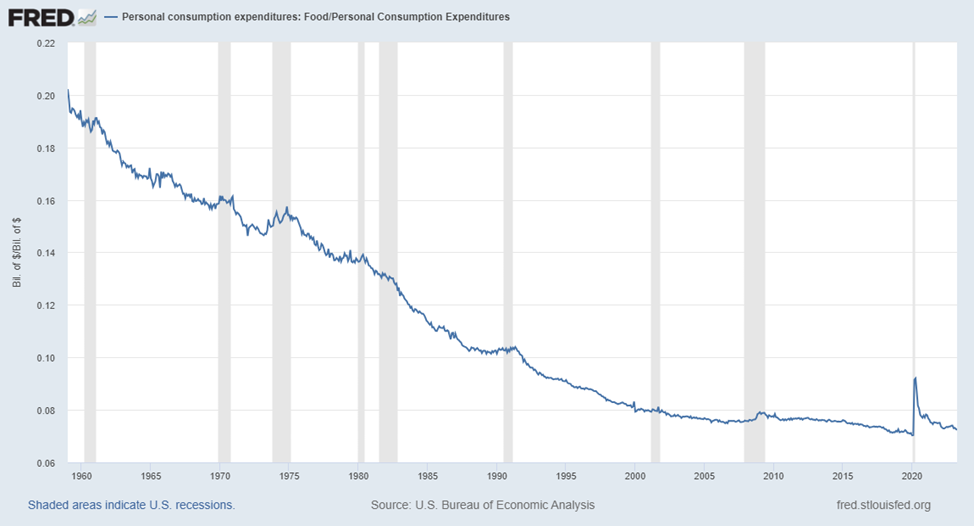
Source: US Bureau of Economic Analysis, FRED.

Interestingly, the spike looks like a blip. Someone oblivious to the events of the past few years might see this chart and say, “Yeah, something strange happened in 2020, but it looks like everything is back to normal.” I’m certain that this doesn’t align with anyone’s experience, however. Even today, no one would say that restaurant visits and grocery store trips cost the same as they did in 2019.

What changed in 2020? Why does this graph not feel right? Assuming the Bureau of Economic Analysis data isn’t totally off (and it is important to be skeptical of government data), why would a January 2023 report on consumer inflation sentiment conclude that “there is a disconnect between the inflation data reported by the government and what consumers say they now pay for necessities”?

The difference lies in the qualitative aspects of our experience as consumers. Spending proportions may have returned to their trend, but that isn’t the whole story. “Shrinkflation” and “skimpflation” have taken their toll on the quantity and quality of the food we enjoy—or maybe the food we tolerate is more apt.

Businesses know that charging higher prices is unpopular, especially when many consumers are convinced that greed is driving price inflation. So businesses resort to reducing the amount of food in the package, diluting the product but keeping the same amount, or otherwise cutting corners in ways that consumers may not immediately notice.

Thankfully, websites such as mouseprint.org document some of these cases:

See the rest here

Be seeing you

Posted in Uncategorized | Tagged: , , , | Leave a Comment »

“Transitory” No Longer: Double-Digit Inflation Is Already Here!

Posted by M. C. on July 23, 2022

https://mises.org/wire/transitory-no-longer-double-digit-inflation-already-here

Joseph T. Salerno

The Bureau of Labor Statistics (BLS) and the media reported the inflation rate—that is, the Consumer Price Index‘s rate of increase—to be 1.3 percent for June 2022 and 9.1 percent year over year (for the last twelve months). This shocked markets and investors because economists’ median forecast had been 1.1 percent for June and 8.8 percent year over year. This shock would have been much greater, however, had the annual inflation rate been reported as the CPI’s compounded annual rate of change for the month or quarter. This calculation method would have revealed the stark reality that double-digit inflation is not just a specter looming on the horizon but is here right now. According to computations I made using the interactive economic data website (FRED) of the Federal Reserve Bank of St. Louis (FRB of St. Louis), the annualized inflation rate for June 2022 was 17.1 percent, while for the second quarter of 2022, the rate was 10.5 percent.

Let us compare these two methods of calculating the annual inflation rate using the figures in the preceding paragraph. According to the BLS, CPI changes are “a measure of the average change over time in the prices paid by urban consumers for a market basket of consumer goods and services.” To say that the monthly inflation rate is 1.3 percent, then, means that the CPI increased by 1.3 percent from the month before. Similarly, a year-over-year inflation rate of 9.1 percent means that the CPI rose by 9.1 percent over the past twelve months. This way of calculating the annual inflation rate is backward looking, because the most recent monthly rate is heavily outweighed by the previous eleven months’ rates.

In contrast, calculating the annual inflation rate by compounding and annualizing the most recent monthly or quarterly rate of change in the CPI gives a better idea of what inflation currently is and how it may be trending. For instance, the 17.1 percent compounded annual inflation rate reported above is derived by assuming that the 1.3 percent monthly rate of change for June continues unchanged for the next eleven months. If the monthly inflation rates appear to be volatile, the compounded annual inflation rate for the last three months may also be computed in a similar manner. As noted above, the compounded annual inflation rate for April 2020 to June 2022 was 10.5 percent. In any case, this computation method is forward looking and more useful for analyzing the implications of fresh inflation data and recent events’ likely impact on the inflation trend.

Now this may seem like merely a technical matter, but some forms of data presentation are clearer and more useful than others, especially during a time of rapid inflation. Presenting the inflation rate as a year-over-year calculation obscures shorter-term but substantial fluctuations that may occur and what they portend for the future, especially if inflationary expectations are beginning to become unhinged. Furthermore, presenting inflation data in annualized form permits clear and easy comparison of inflation rates in periods of varying length. For example, up until January 1997, the FRB of St. Louis, which for many years was the most “monetarist” and inflation conscious of the regional FRBs, displayed inflation rates with “growth triangle” in its monthly release (suspended in March 2015), National Economic Trends (NET). The triangle, which resembles an intercity mileage table on a highway map, consisted of compounded annual inflation rates for each of the nineteen immediately preceding months and for all series of consecutive months in that range, totaling 190 rates in all.\

See the rest here

Be seeing you

Posted in Uncategorized | Tagged: , , , | Leave a Comment »

Doug Casey on the Labor Shortage and other Disturbing Distortions…

Posted by M. C. on May 20, 2021

Are millions going to be kicked out of their apartments and houses? Does this mean we’re going to have a new wave of homeless people? Or will the State just take over their obligations, so we have overtly socialized housing? The small landlords, in particular, will be hurt worst. I’m not sure what the way out is. The country has been painted into a corner.

I’m shocked that I don’t see any of this being discussed anywhere. The country is sleepwalking into a living nightmare, and we’re just scratching the surface of all the problems that will have to be confronted in the years to come.

https://internationalman.com/articles/us-labor-shortage-and-the-implications-of-stimulus-checks/

by Doug Casey

International Man: According to the recent Bureau of Labor Statistics (BLS) jobs report, only 266,000 new jobs were created in April—well below the one million new jobs that was expected.

At the same time, American businesses are desperately seeking to fill job openings which they can’t fill. A survey by the National Federation of Independent Business found that 44% of small businesses had jobs they couldn’t fill, which is a record high.

What’s going on with these seemingly contradictory trends?

Doug Casey: First of all, I don’t trust the government’s statistics. Some are surely better than others, but especially when we’re looking at monetary and economic numbers, it’s increasingly apparent that the US government’s statistics are only marginally more reliable than those of the Argentine government at this point. As the US is increasingly politicized, they’ll deteriorate further, fudged and adjusted for propaganda purposes.

Eventually, they’ll approach the inaccuracy of those in the old Soviet Union. It’s understandable, I suppose, because people believe in, and love to quote, that old saw of Franklin Roosevelt’s: “We have nothing to fear but fear itself.” It’s nonsense, of course; you can ignore reality, but you can’t ignore the consequences of ignoring reality.

The government likes to publish happy, optimistic numbers for lots of reasons. A belief that economic health is based on psychological smiley faces is prominent among them. Unfortunately, optimism can blow away as easily as a pile of feathers in a hurricane.

That said, there are huge distortions that have been cranked into the economy because of the ongoing COVID hysteria, compounded by the government’s reaction to it. It appears there are over 16 million workers collecting unemployment bennies, while there are about 8.5 million job openings, 13% more than in the before times. How is that possible? Lots of fast-food chains are paying $15 an hour, plus recruiting bonuses—and that’s for unskilled labor. There are loads of highly-paid manufacturing and construction jobs going begging. Anyone who wants a job can have one.

There are several reasons for this.

One is that COVID hysteria is slacking off somewhat but still in high gear. A high proportion of the population wear masks when driving alone, walking alone, or even participating in a Zoom call (presumably to virtue signal). Needless to say, these types are afraid to go to work or be among other people. They want to self-isolate out of fear. They won’t work, or will work less, from hypochondria. Those that will work have to be induced with hazard pay.

Meanwhile, a combination of state unemployment benefits, $300 Federal unemployment, and Federal stimmy checks means that a lot of them can take home more not working than working.

It’s easier to stay home, get up late, binge-watch Netflix, and collect tax-free money than commute to work. After a year, it can turn into an ingrained bad habit.

International Man: Since the beginning of the pandemic, the US government has been sending stimulus checks to Americans—mostly to those who experienced no reduction in their income or job loss. This flurry of free money has led to people choosing not to work.

What’s your take on this?

Doug Casey: You get what you pay for. And if you pay people to stay at home, they’ll do that. People are consuming more than ever. Retail sales are way up because of all the funny money the government is practically helicopter dumping, while a lot less people are producing. This is a guaranteed formula for economic disaster. And it’s not just an economic failure but a moral failure.

See the rest here

Be seeing you

Posted in Uncategorized | Tagged: , , , , | Leave a Comment »