MCViewPoint

Opinion from a Libertarian ViewPoint

Posts Tagged ‘Consumer Price Index’

Monetary Freedom Instead of Central Banking – The Future of Freedom Foundation

Posted by M. C. on December 29, 2022

The boom-bust cycles of inflations and recession and the political use of money-creation to serve the deficit spending needs of governments will never be effectively and permanently ended until central banking has been ended. Monetary matters must be fully returned to the market process of competitive supply and demand.

https://www.fff.org/explore-freedom/article/monetary-freedom-instead-of-central-banking/

by Richard M. Ebeling

The United States and most of the rest of the world are, once again, in the midst of an inflationary crisis. Prices in general are rising at annualized rates not experienced by, especially, the industrialized countries of North America and Europe for well over 40 years. More than 50 percent of the U.S. population is under 40 years of age, meaning that half of the people in the country have never experienced in their life time a period of rising prices such as is now occurring.Monetary central planning is no more desirable or workable than any other form of government central planning.
[Click to Tweet]

It is not surprising, therefore, the shock that it has had for so many. There was a period of time in the late 1970s when price inflation, as measured by the Consumer Price Index (CPI), was going up at an annualized rate of nearly 15 percent. That was the highest since during the American Civil War, more than a hundred years earlier. So, the nearly 9 percent price inflation in the summer of 2022 was something totally new for the average American family.

Prices do not all rise by the same amount at the same time

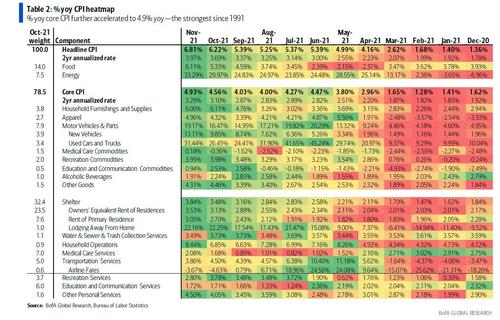
It is worth keeping in mind that the headline CPI number is only a statistical averaging of a selected group of individual prices chosen to reflect the representative purchases of an “average” urban American family in terms of the goods purchased and their relative amounts in a hypothetical “basket” of items. Break that down into the subcategories of different goods and services, and many of these subgroups of goods have been registered as rising much more or noticeably less than the general CPI number. For instance, in August of 2022, fuel oil prices were almost 69 percent higher than a year earlier, while food prices in general were between 11 and 13 percent above where they were in August of 2021. Housing prices were “only” 6 percent above 12 months earlier.

But any way that it is looked at, this is a new experience for most Americans used to an average rise in prices of only 2 to 3 percent a year for much of the last four decades. It is one thing to be a bit irritated because something that cost, say, $100 last year costs $102 today. But it is another matter entirely when what cost $100 last year may now cost $133 or even $169. When that is happening not to just one or two or three significant items in a basket of purchased goods but to many or most of what is regularly being bought, “inflation” becomes a budgetary crisis for many families across the country.

Rising prices are the effect of an earlier monetary action

What is missed in all of this is that the general rise in prices is a symptom and not the cause of the problem. We all know that if we take someone’s temperature, the number registered on the thermometer indicating a fever is not the cause of that fever; it is merely telling us that person’s body temperature is above what is considered “normal.” It does not explain or answer what is behind the “read” on the thermometer.

Suppose that someone has a regular income of $1,000 and that he spends, say, $500 on commodity “x,” $250 on commodity “y,” and $250 on commodity “z.” If this is all the money at his disposal and he wants to increase his spending on commodity “y” to $300, then he must reduce his purchases by $50 on either commodity “x” or commodity “z,” or some reduced combination of the two. He might draw down previously accumulated cash holdings or borrow the $50 from someone else. But in the former case, there will be a point at which he has drawn down all his available cash, and he must therefore restrict his overall purchases to his regular $1,000 income. If he borrows the money, it means that the lender must reduce a loan to another borrower by $50.

Whether it’s an individual or a community of individuals, the total sum of money available to that person or group of individuals sets the maximum of dollars offered in exchange for desired goods and services, as a whole. Only if the number of dollars in the hands of that individual or community increases can the demand for and prices of one or more goods rise without some complementary decline in money demand for some other good(s). Overall “price inflation” cannot occur over any sustained period of time without a preceding or contemporaneous increase in the total amount of money in the economic community of buyers and sellers.

The gold standard served as a “check” on inflation

See the rest here

Be seeing you

Posted in Uncategorized | Tagged: , , , | Leave a Comment »

Inflation Makes People Poorer (And It’s the Government’s Fault)

Posted by M. C. on August 17, 2022

Therefore, the poorest are the ones who actually pay for the government. It is precisely because of governments that the poor and the lower middle class, in most cases, don’t get richer. It is the government that perpetuate poverty, precisely to justify their existence by pretending to help the poorer. After all, if there were no monetary inflation created by governments, prices would tend to decrease as the productivity of the economy rose and the standard of living would rise.

  • burden

https://mises.org/wire/inflation-makes-people-poorer-and-its-governments-fault

André Marques

The Consumer Price Index (CPI) in the US was 9.1 percent in June. Taking into account that the government lies about inflation, it is better to consider Shadow Government Statistics’ CPI (based on the 1980s CPI methodology), which was (as of July 13) about 17 percent.

The government claims that this high CPI is due to Russia’s invasion of Ukraine (you could argue that, one of the reasons is the sanctions on Russia’s economy, which don’t do much to harm to the Russian government and hurts ordinary people both inside and outside Russia). But this is just an excuse for the government to not admit the blame. It is clear the war has an influence on the CPI, as it eliminates the supply of various goods and services, which ends up increasing prices. However, the CPI has been going up since February 2021.

The 2020 and 2021 lockdowns (and the followed supply shocks) were also a big factor, but the real reason prices are going up is the inflation (monetary expansion) created by the US government both in 2020 and 2021.

Yes, supply shocks cause increases in SOME prices in the economy, but not a general increase in the prices of goods and services. If there is a supply shock of certain goods (making their prices higher), but the money supply does not change, there will be a new equilibrium of supply and demand for the various goods and services in the economy (since the money supply is the same and individuals will have to change the allocation of their budget, so the prices of the goods that will have a lower demand will decrease).

Once the supply shock of these goods ended, their supply would increase, and their prices would decrease (changing the equilibrium of supply and demand once again). Only an increase in money in circulation can make ALL (or almost all) prices in the economy rise simultaneously, as the value of money decreases and more units of currency are needed to pay for goods and services.

Inflation (the expansion of the money supply) and the consequent increase in prices is a disguised tax. The US government increased its spending and its budget deficit. So, it issued more debt securities, which were mostly purchased by the Federal Reserve (Fed) through an increase in the monetary base (M0). Then, the government spent the newly created money, increasing the amount of money in circulation in the economy (M1 and M2), which tends to make prices higher.

See the rest here

Be seeing you

Posted in Uncategorized | Tagged: , , | Leave a Comment »

“Transitory” No Longer: Double-Digit Inflation Is Already Here!

Posted by M. C. on July 23, 2022

https://mises.org/wire/transitory-no-longer-double-digit-inflation-already-here

Joseph T. Salerno

The Bureau of Labor Statistics (BLS) and the media reported the inflation rate—that is, the Consumer Price Index‘s rate of increase—to be 1.3 percent for June 2022 and 9.1 percent year over year (for the last twelve months). This shocked markets and investors because economists’ median forecast had been 1.1 percent for June and 8.8 percent year over year. This shock would have been much greater, however, had the annual inflation rate been reported as the CPI’s compounded annual rate of change for the month or quarter. This calculation method would have revealed the stark reality that double-digit inflation is not just a specter looming on the horizon but is here right now. According to computations I made using the interactive economic data website (FRED) of the Federal Reserve Bank of St. Louis (FRB of St. Louis), the annualized inflation rate for June 2022 was 17.1 percent, while for the second quarter of 2022, the rate was 10.5 percent.

Let us compare these two methods of calculating the annual inflation rate using the figures in the preceding paragraph. According to the BLS, CPI changes are “a measure of the average change over time in the prices paid by urban consumers for a market basket of consumer goods and services.” To say that the monthly inflation rate is 1.3 percent, then, means that the CPI increased by 1.3 percent from the month before. Similarly, a year-over-year inflation rate of 9.1 percent means that the CPI rose by 9.1 percent over the past twelve months. This way of calculating the annual inflation rate is backward looking, because the most recent monthly rate is heavily outweighed by the previous eleven months’ rates.

In contrast, calculating the annual inflation rate by compounding and annualizing the most recent monthly or quarterly rate of change in the CPI gives a better idea of what inflation currently is and how it may be trending. For instance, the 17.1 percent compounded annual inflation rate reported above is derived by assuming that the 1.3 percent monthly rate of change for June continues unchanged for the next eleven months. If the monthly inflation rates appear to be volatile, the compounded annual inflation rate for the last three months may also be computed in a similar manner. As noted above, the compounded annual inflation rate for April 2020 to June 2022 was 10.5 percent. In any case, this computation method is forward looking and more useful for analyzing the implications of fresh inflation data and recent events’ likely impact on the inflation trend.

Now this may seem like merely a technical matter, but some forms of data presentation are clearer and more useful than others, especially during a time of rapid inflation. Presenting the inflation rate as a year-over-year calculation obscures shorter-term but substantial fluctuations that may occur and what they portend for the future, especially if inflationary expectations are beginning to become unhinged. Furthermore, presenting inflation data in annualized form permits clear and easy comparison of inflation rates in periods of varying length. For example, up until January 1997, the FRB of St. Louis, which for many years was the most “monetarist” and inflation conscious of the regional FRBs, displayed inflation rates with “growth triangle” in its monthly release (suspended in March 2015), National Economic Trends (NET). The triangle, which resembles an intercity mileage table on a highway map, consisted of compounded annual inflation rates for each of the nineteen immediately preceding months and for all series of consecutive months in that range, totaling 190 rates in all.\

See the rest here

Be seeing you

Posted in Uncategorized | Tagged: , , , | Leave a Comment »

Why Price Deflation Is Always Good News | Mises Wire

Posted by M. C. on January 30, 2022

A general decline in the prices of goods and services in response to an increase in the pool of wealth is always good news for individuals. Furthermore, a general decline in prices, which is associated with the bursting of various bubbles, is also good news. The less nonproductive bubble activities, the better things will be for wealth generators and hence for the overall pool of wealth.

https://mises.org/wire/why-price-deflation-always-good-news

Frank Shostak

Most commentators are currently preoccupied with large increases in the Consumer Price Index (CPI), which is labeled as inflation. The yearly growth rate of the CPI stood at 7.0 percent in December against 6.8 percent in November and 1.4 percent in December 2020.

shos1

Pundits have been blaming the strong increase in the momentum of the CPI on the supply disruptions because of covid-19, but the key behind this strong increase in the momentum of the CPI is reckless monetary pumping by the Fed. Observe that in January 2000 the Fed’s balance sheet stood at $0.6 trillion. By the end of 2021, it had climbed to $8.8 trillion.

shos

As a result of this pumping, the yearly growth rate of the Austrian money supply metric increased by a massive 79 percent in February 2021 from 4.8 percent in January 2020. (Note that some of the increases in money supply are the result of the monetization of large government outlays).

shos

On account of the sharp decline in the yearly growth rate of the Austrian money supply measure, from 79 percent in February 2021 to 15.4 percent in November 2021, the momentum of the CPI is likely to peak toward the end of 2022. Afterwards a strong decline in the momentum is likely to emerge.

shos

A possible decline in the yearly growth rate of prices coupled with a likely decline in economic activity could ignite expectations of a general decline in the prices of goods and services, i.e., deflation.

Most Commentators Fear Deflation

For most economic commentators, a general decline in prices is considered as bad news. According to these observers, a general decline in prices generates expectations for further declines in prices and slows down individuals’ propensity to spend. This in turn undermines the aggregate demand. A decline in the aggregate demand because of the decline in consumer expenditure leads to a decline in the aggregate supply and thus to a decline in economic growth.

All this sets in motion an economic slump. As the slump further depresses the prices of goods, the pace of economic decline intensifies.

The view that consumers postpone their buying of goods because prices are expected to decline is, however, questionable.

This would mean that people have abandoned any desire to live in the present. Without the maintenance of life in the present, no future life is conceivable.

According to Menger, the founder of the Austrian school of economics, “An imperfect satisfaction of needs leads to the stunting of our nature. Failure to satisfy them brings about our destruction. But to satisfy our needs is to live and prosper. Thus the attempt to provide for the satisfaction of our needs is synonymous with the attempt to provide for our lives and wellbeing. It is the most important of all human endeavors, since it is the prerequisite and foundation of all others.”

Is the Fall in Prices Bad News for the Economy?

What characterizes industrial market economy under a commodity money such as gold is that the prices of goods follow a declining trend.

According to Joseph Salerno

In fact, historically, the natural tendency in the industrial market economy under a commodity money such as gold has been for general prices to persistently decline as ongoing capital accumulation and advances in industrial techniques led to a continual expansion in the supplies of goods. Thus throughout the nineteenth century and up until the First World War, a mild deflationary trend prevailed in the industrialized nations as rapid growth in the supplies of goods outpaced the gradual growth in the money supply that occurred under the classical gold standard. For example, in the US from 1880 to 1896, the wholesale price level fell by about 30 percent, or by 1.75 percent per year, while real income rose by about 85 percent, or around 5 percent per year.

In a free market, the rising purchasing power of money, i.e., declining prices, is the mechanism that makes the great variety of goods produced accessible to many people.

See the rest here

Be seeing you

Posted in Uncategorized | Tagged: , , , , , | Leave a Comment »

To Attack the Root of Evil, Fix the Money | The Libertarian Institute

Posted by M. C. on January 14, 2022

https://libertarianinstitute.org/articles/to-attack-the-root-of-evil-fix-the-money/

by Jp Cortez

After the Consumer Price Index surged last year to its highest level since 1982, politicians are feeling pressure from constituents to do something about it.

Last Monday, President Joe Biden announced $1 billion in grants, loans, and other assistance for small meat producers. Another costly government program will, supposedly, help tame rapidly rising beef and poultry costs.

Four giant companies control 85% of the market for meat—raking in massive profits while families pay higher prices. I’m glad @POTUS is taking steps to create a more competitive beef and poultry industry. We need to break up Big Ag and lower prices. https://t.co/EHQZWaD2du

— Elizabeth Warren (@SenWarren) January 3, 2022

Massachusetts Senator Elizabeth Warren has been on a tear lately, and there is a startling commonality between all these ideas:

Prices at the pump have gone up. Why? Because giant oil companies like @Chevron and @ExxonMobil enjoy doubling their profits. This isn’t about inflation. This is about price gouging for these guys & we need to call them out. pic.twitter.com/kxiQkC2tYa

— Elizabeth Warren (@SenWarren) November 20, 2021

Consolidation in the semiconductor industry is causing shortages and supply chain bottlenecks that increase consumer prices and hurt workers. I’m urging @SecRaimondo to act swiftly to increase competition. https://t.co/Y7Izd6X0Fl

— Elizabeth Warren (@SenWarren) December 17, 2021

This is your brain on fiat monetary systems and central banking: price inflation is caused by everything except for printing loads of new money.

If Senator Warren believes that prices increase because of the greed of price gouging companies, does she believe that when prices fall, it is the result of corporate benevolence?

See the rest here

Be seeing you

Posted in Uncategorized | Tagged: , , , , , | Leave a Comment »

And Just Like That, Inflation Is About To Disappear? | ZeroHedge

Posted by M. C. on December 12, 2021

In any case, what we though this summer was just a joke appears to be coming true, because as the BLS has reported, starting next month it will adjust the weights for its Consumer Price Index basket, which will be calculated “based on consumer expenditure data from 2019-2020.” Alas, there is no further detail on this critical topic, although we will take any bet that post-revision reported inflation will drop because, well, “adjustments.”

https://www.zerohedge.com/markets/and-just-inflation-about-disappear

Tyler Durden's Photoby Tyler Durden

Earlier this year, when inflation was still “transitory” two Fed chairs, Powell and Bernanke, made comments which we joked only make sense if the definition of inflation is changed:

*POWELL:FOMC PREPARED TO ADJUST POLICY IF EXPECTATIONS GO BEYOND

by changing definition of PCE and CPI — zerohedge (@zerohedge) July 28, 2021

BERNANKE: COMMODITY PRICES WON’T ADD TO INFLATION GOING FORWARD

Why? Are we changing the definition of CPI again — zerohedge (@zerohedge) August 25, 2021

Sadly, our feeble attempts at humor were not unjustified, and as any economic history buff knows the US dramatically changed how it calculates consumer inflation back in the 1980s, an event extensively covered by AllianceBernstein former chief economist Joseph Carson on this website in the past (see “Consumer Price Inflation: Facts vs. Fiction“) with the most important difference being that while the CPI of the 1970s included house price inflation, the current measure does not. Instead, home price pressures have been swept in the purposefully nebulous Owner-Equivalent Rent which can be whatever politicians wants it to be (there have been other definitional changes, see here, here, here and here for more). Bottom line, however, is that if today’s CPI did include house prices in its measurement, the currently reported inflation numbers for house price inflation would push CPI (and core CPI) to double-digit gains.

Of course, it is politically inconvenient to report true inflation is – just see what happens in any banana republic where society is fed up with runaway inflation. It’s also why politicians on both sides of the aisle are always eager to tweak the definition of inflation ever so slightly (or not so slightly) so it appears to be less than it truly is. After all, for them masking reality is a matter of political survival.

In any case, what we though this summer was just a joke appears to be coming true, because as the BLS has reported, starting next month it will adjust the weights for its Consumer Price Index basket, which will be calculated “based on consumer expenditure data from 2019-2020.” Alas, there is no further detail on this critical topic, although we will take any bet that post-revision reported inflation will drop because, well, “adjustments.”

In the same press release, we also read that “the BLS considered interventions, but decided to maintain normal procedures”… whatever those are. Said otherwise, the BLS may not be “intervening” for now, but when the inflationary rubber hits the road next year with the midterms coming up fast and Dems ratings still in the dumps, we doubt that the BLS will have any qualms to “intervene.”

Incidentally, this “update” may explain the conviction behind Biden’s statement today: in a statement after the blistering hot CPI report came out…

… Joe Biden said that despite experiencing the most rapid inflation in almost 40 years in November, U.S. price increases are slowing, in particular for gasoline and cars.

“Today’s numbers reflect the pressures that economies around the world are facing as we emerge from a global pandemic — prices are rising… But developments in the weeks after these data were collected last month show that price and cost increase are slowing, although not as quickly as we’d like,” he said. Biden’s chief of staff Ronald Klain chimed in too:

We’ve made progress, but we’ve got to get prices down, and people have to feel the progress at their kitchen tables.https://t.co/YH102YVlQp — Ronald Klain (@WHCOS) December 10, 2021

Well, all that prices needs to slow “as quickly as we’d like” at least in government reports such as the CPI, is for the BLS to give them a gentle nudge lower.

Be seeing you

Posted in Uncategorized | Tagged: , , , , | Leave a Comment »

Shrinkflation, Inflation’s Sneaky Cousin, Is on the Rise | Mises Wire

Posted by M. C. on July 29, 2021

What is causing this increase in shrinkflation? Well, since shrinkflation is in fact a form of inflation, the short answer is that the same factors have caused inflation. As you may already be aware, many are blaming shortages and disruptions in the supply chain for the recent increases in inflation, but that hardly explains the whole story.

https://mises.org/wire/shrinkflation-inflations-sneaky-cousin-rise

Inflation has been on the rise for the past year and in the last few months it has accelerated. In June 2021, inflation, measured by the Consumer Price Index (CPI), hit the highest level since 2008. By inflation, economists refer to the increase in the general level of prices, which means that prices on average are increasing. The Bureau of Labor and Statistics (BLS) has a basket of goods and services that it tracks and uses to create a measure of the CPI. While inflation is the topic of the day in the news media and everyday conversations, many have not heard about its sneaky cousin, shrinkflation.

The term shrinkflation, is credited to British economist Pippa Malmgren, and refers to the shrinking weight of the products while the price for the package remains the same. This is in effect another form of inflation, since the per unit price of goods increases when products shrink. However, shrinkflation is trickier, since most consumers do not notice it (see here for a few examples of shrinkflation). Shrinkflation is an ongoing process, but we are seeing more of it in the past year, and especially the first half of 2021, as businesses scramble to catch up with increasing costs of production. Shrinkflation is so widespread today that there is a dedicated Reddit page for it.

Many complain about businesses resorting to shrinkflation and regard it as a sneaky way to increase prices. Yet many of the critics do not realize that businesses have no choice but to increase prices. Anyone who is paying attention to prices in the first half of 2021 will know that it is not only the price of consumer goods that it is increasing but also the prices of producer goods. In other words, the inputs used in the production of the goods we consume, including labor, have been getting more expensive. Consequently, businesses in a fight to maintain their profit margins have resorted to increasing prices or shrinking the size or weight of their products.

Normally, the BLS accounts for the weight of the products it tracks, which would allow them to account for shrinkflation, but as the Washington Post reports, the BLS has not been able to do this very well during the pandemic. This means that the current inflation measure, as measured by CPI, is most likely underreporting the extent of current inflation.

What is causing this increase in shrinkflation? Well, since shrinkflation is in fact a form of inflation, the short answer is that the same factors have caused inflation. As you may already be aware, many are blaming shortages and disruptions in the supply chain for the recent increases in inflation, but that hardly explains the whole story.

The two main candidates to blame are the Fed and the government. The Fed has printed tremendous amounts of money, which has led to the doubling of its balance sheet since March 2020. This is in fact what inflation is, and this is the cause of what we normally refer to as inflation, which, to be more accurate, is price inflation. In general, we know that the more money we print, holding all else equal, the more inflation we will get, and that is part of what we are seeing now. On the other hand, we have had the federal government spend money at record levels for a peacetime period. This also has led to an increase of demand beyond what one would expect in the circumstances we have been in since spring of 2020. For example, retail sales have increased rapidly and have been above trend since late 2020. While some of this can be seen as catching up after the decrease we saw in the second quarter of 2020, it is definitely gone beyond catching up, as is clear from the graph below. Government spending has become a topic of concern even for mainstream economists like Larry Summers, who is now worried about the economy overheating because of it.

Retail Sales

Lastly, while the supply chain disruptions are blamed on covid-19, it is the lockdowns instituted by governments, in the US and other countries, that are the main culprit behind these supply chain disruptions. The problem with the lockdowns was that they completely ignored the cost-benefit analysis by arbitrarily determining what constituted an essential business and what did not. As you may well know, one can ignore the laws of economics, but not their consequences, and we are now suffering the consequences of these arbitrary lockdowns. The million-dollar question today is, How long will this rising inflation and shrinkflation last? The Fed insists that this inflation is transitory, but many, including BlackRock’s CEO, are concerned that this may not be the case. With the inflation data from June, we have some evidence that inflation may be more than transitory. As can be seen from the graph below, the transitory portion of inflation (base effects) was expected to retreat for June (the bar after the dashed line), but CPI advanced beyond the increase in May (reflected in the green portion of the bar added to the predicted June CPI by Oxford Economics).

US Headline CPI Inflation
  (The graph is modified to show the actual CPI change for June, by adding the green portion of the bar.)

Hence, with all the money that the Fed has printed and is continuing to print, and the increased spending by the federal government, we may well end up seeing higher inflation over the next few years. Whether this will happen or not remains to be seen, but one thing is for sure: the shrinking size and weight of the products is here to stay and it will only get worse as inflation pressures continue to worsen. Author:

Klajdi Bregu

Dr. Klajdi Bregu is an assistant professor of economics at IU South Bend’s Judd Leighton School of Business and Economics and a fellow at the Center for Market Education. Prior to his appointment to the Leighton School faculty, Dr. Bregu taught at the University of Arkansas. He has published research in the Journal of Economic Dynamics and Control and the Southern Economic Journal.

Be seeing you

Posted in Uncategorized | Tagged: , , | Leave a Comment »